Understanding Your Revenue Reporting Dashboard
We’re excited to share our latest product update: the Grid & Pixel revenue reporting dashboard! Now, you can get immediate insights into how your Grid & Pixel graphics are performing and the value they’re adding to your business.
You can access your revenue reporting dashboard by visiting https://gridandpixel.com/reports, or inside Shopify on the left navigation bar.
In this article, we’ll cover:
Understanding the Layout of Your Reporting Dashboard
Take a look at the key elements of your reporting dashboard.
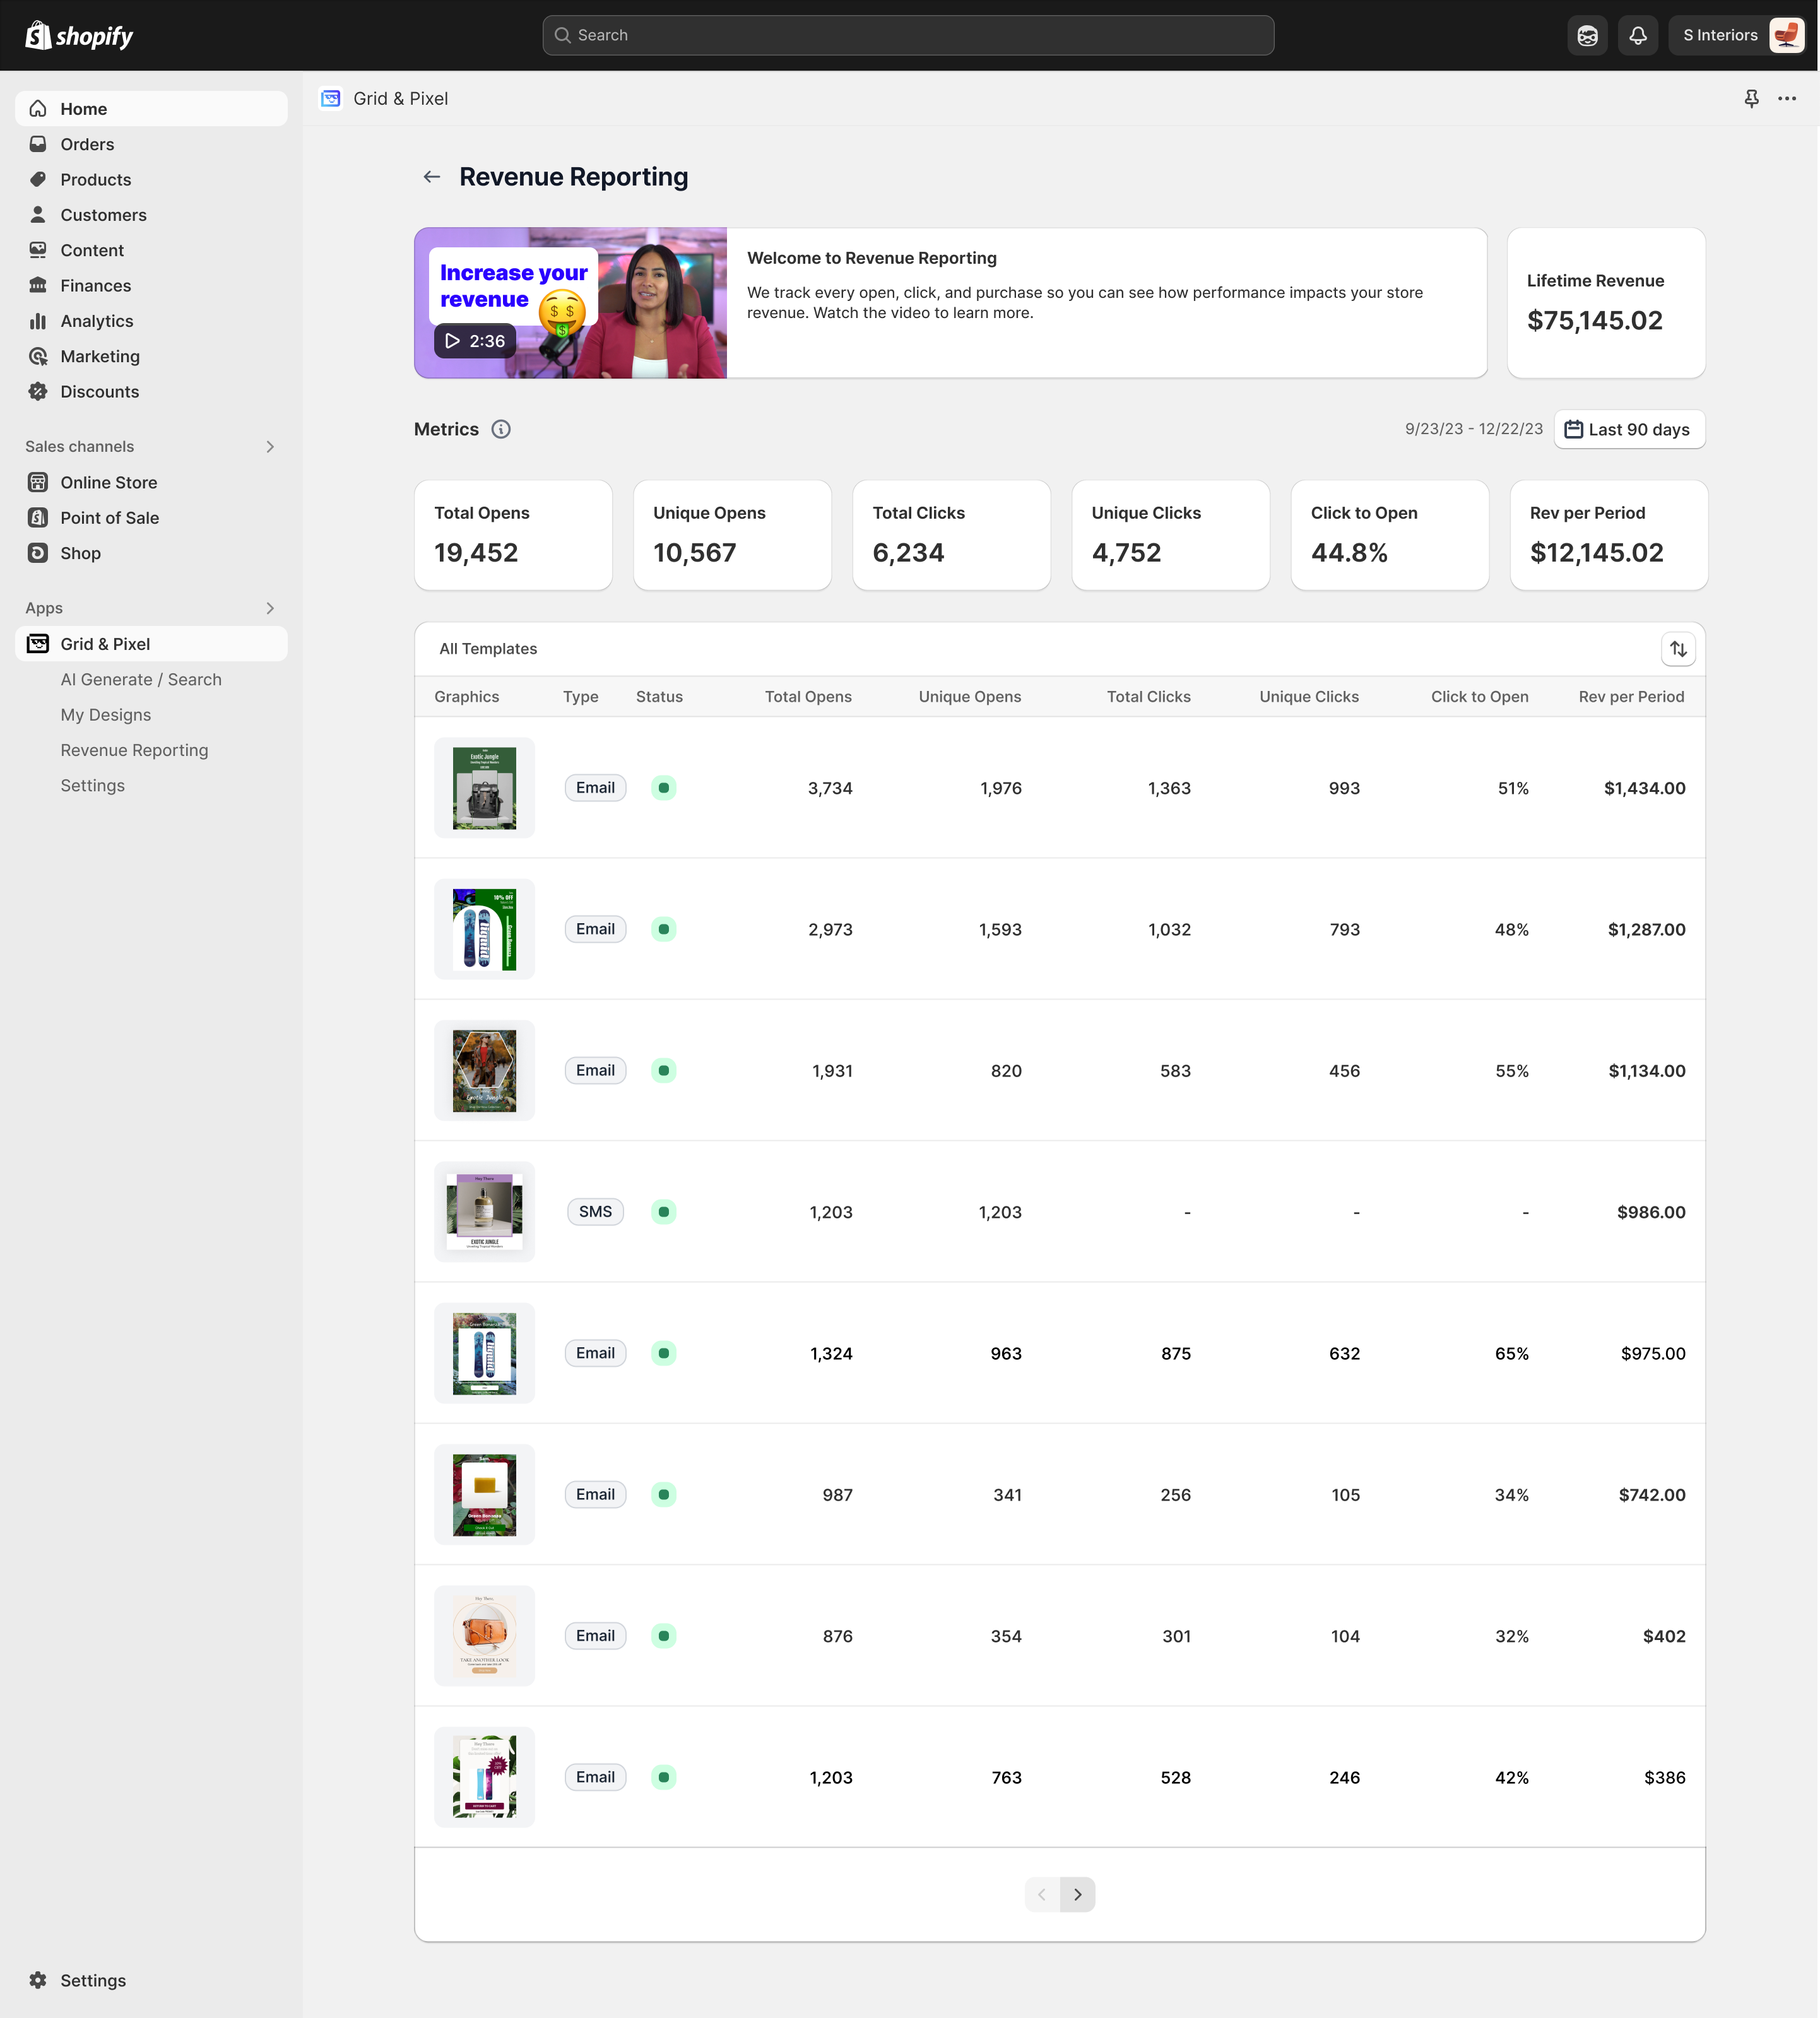
Topline metrics: At the top of your dashboard, you’ll see lifetime revenue as well as topline email metrics related to the emails and SMS where you’ve added Grid & Pixel graphics.
Date range: Slightly above the topline metrics, you’ll see a date range for the metrics on your dashboard. You can click this date range and adjust it to your preference.
Templates and individual metrics: Below the topline metrics, you’ll see a sortable list of your templates with rendered opens. You’ll see a thumbnail of the design, as well as individual performance metrics. This will also tell you what type of graphic it is (email or SMS) and the status of that graphic (more on that below).
Status: This is an individual metric that lets you know the status of each graphic. If there is a status that requires action, we link it in the status message. Hover over the colored icon (green, yellow, or red) in the Status column to see one of four statuses:
All Good (green): Everything is working perfectly with your graphic!
Upgrade your email with new code to enable click tracking (yellow): Lets you know that you’re using old code without click tracking enabled. We recommend .
Your graphic is delivering. Update code to include email and phone variables to enable revenue reporting (yellow). Lets you know that you're using old code that might not be collecting unique opens or clicks. We recommend . If you’re using HTML, make sure you are inputting the correct variables from your ESP for customer email and phone number.
Get personalization code to embed into a campaign or automation (red). Based on the metrics, we suspect you’ve tested the code but still need to finish sending it to a wider audience.
Template sort: You’ll see an icon with two arrows pointing in opposite directions in the top-right corner of your template list. Click on this icon to sort by highest clicks, opens, click-to-open rate, or revenue (revenue is the default).
Last data update: There’s an “i” in a circle next to the metrics headline. Hover over it to see when the data was last updated. Metrics are updated every 10 minutes.
Understanding the Numbers in Your Reporting Dashboard
Here’s a rundown of what numbers you’ll see in your report:
Lifetime revenue: Total revenue ever attributed to a Grid & Pixel graphic since you added the app. The revenue metrics are pulled directly from your Shopify account.
Total opens: This tells you the total number of Grid & Pixel graphics that have been rendered in the date range.
Unique opens: This tells you the unique number of people who have opened an email and therefore rendered a Grid & Pixel graphic. If you’re on the Do It Yourself plan, this metric is how we calculate reach.
Total clicks: The total number of clicks that Grid & Pixel graphics have driven. If you see “0” then check the Status of that message — it’s likely that you need to update the code to enable click tracking.
Unique clicks: The number of unique people who have clicked on a Grid & Pixel graphic. If you see “0” then check the Status of that message — it’s likely that you need to update the code to enable click tracking.
Click to open: The unique number of clicks divided by the unique number of opens.
Rev per period: The amount of revenue generated during the date range you’ve selected.
Understanding How Revenue is Attributed and Displayed in Your Reporting Dashboard
Last touch: We attribute revenue to Grid & Pixel graphics if they are the “last touch” — or the last engagement — that someone had before making a purchase, based on the data we have. If someone saw a Grid & Pixel graphic in a welcome email 5 days ago and a Grid & Pixel graphic in an SMS message 2 days ago and then purchased, we would only attribute revenue to the SMS since it was the “last touch.”
Attribution window: The attribution window is the window of time between when a graphic renders and when a purchase happens. We use a 7-day attribution window, so any purchases made within 7 days of that “last touch” or last engagement on a Grid & Pixel graphic would be revenue attributed in your dashboard. You’ll have the ability to adjust the attribution window soon!
Overall, what’s important to note is that we are only aware of the data coming from flows and campaigns that feature Grid & Pixel graphics. That means the data you see in your Grid & Pixel dashboard might look slightly different from what’s in your ESP, which has different visibility across your marketing campaigns and flows.
Time zone: We convert the attribution dates of all purchases to your local time zone.
This is important because if team members are in different time zones, they might see slightly different numbers. It could also impact customer attribution, for instance if a customer opens or clicks and their time zone is a day ahead. Even though it’s “today” for them, it would actually show up as “yesterday” for you since it’s going off your local time zone.
Currency: Your revenue will be displayed in the currency associated with your Shopify store and purchases there.
Frequently Asked Questions
Why are my clicks reading as “0” even though I see metrics for opens?
There are three big reasons that you might be seeing zeroes for clicks:
Check the Status next to the individual template and see if it’s a yellow icon. Hover over the icon and read the error message. Both error messages require you to to enable click tracking, with a “Get Code” link to easily update.
Check your date range filters. If you’re looking at a template you used in a campaign two months ago but are filtering to only yesterday’s results, then you’d likely see very low metrics.
Check if it’s an SMS template. If you’re looking at an SMS template, the clicks will always be marked as “0” because click data doesn’t appear for SMS. You will only see open data.
Why are my metrics on Grid & Pixel different from my ESP?
There are a few key reasons that our metrics might not match your ESP’s metrics:
Different ESPs use different attribution windows. Some ESPs also have different attribution windows for email and SMS, too. If they are different from Grid & Pixel’s attribution window, the data can look different.
Different ESPs count attribution differently. Some ESPs have multi-channel or omnichannel attribution, which actually attributes the same conversion to multiple channels. Our data only attributes revenue from Grid & Pixel graphics.
Different ESPs count revenue adjustments differently. Order cancels, refunds, partial refunds, and voids are not currently subtracted from your Grid & Pixel revenue report. Your ESP might deduct some or all revenue adjustments from its revenue numbers.
Grid & Pixel graphic data is a more narrow picture than your ESP provides. Simply put, our dashboard only reports on revenue and activity driven by Grid & Pixel graphics. Your ESP will have additional data on emails and SMS that do not feature Grid & Pixel graphics, and possibly other revenue channels as well.
How do I change the attribution window?
You will be able to adjust the attribution window in a future product update… stay tuned!